
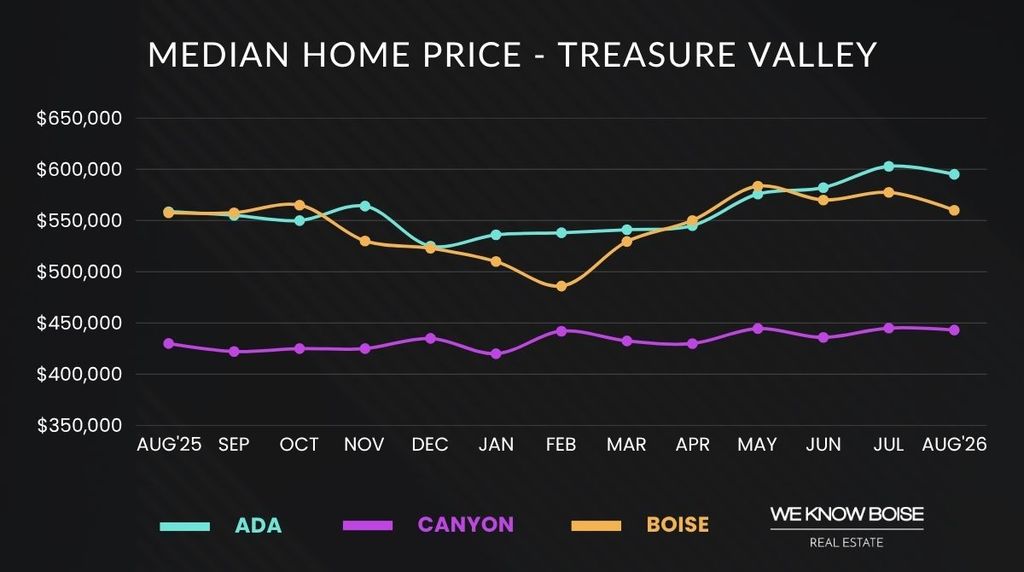
Home prices in Ada County moved lower in August after setting a new record in July, while sales activity continued to run ahead of last year.
Ada County recorded 953 closed sales in August, up 14.8% from last year and the strongest August total since 2020. Canyon County sales increased 7.8% to 472.
The increase wasn’t limited to August. Through the first eight months of the year, closed sales are up 15% in Ada County and 8.9% in Canyon County compared with the same period last year.
A pullback from July is not unusual for this time of year. Home prices in the Treasure Valley often rise through spring and early summer before moderating in the second half of the year.
This August, that seasonal price movement came alongside a higher number of closed sales. That suggests the decline in price was more about the mix and timing of sales than a sharp drop in demand.
According to Freddie Mac, the average 30-year fixed mortgage rate was 6.76% as of September 10, compared with 6.35% a year earlier. Higher rates continue to limit how much buyers can stretch, especially with prices still above last year.
The increase in sales is especially notable because borrowing costs are higher than they were a year ago. Affordability is limiting demand, but not enough to offset the number of buyers still purchasing homes.
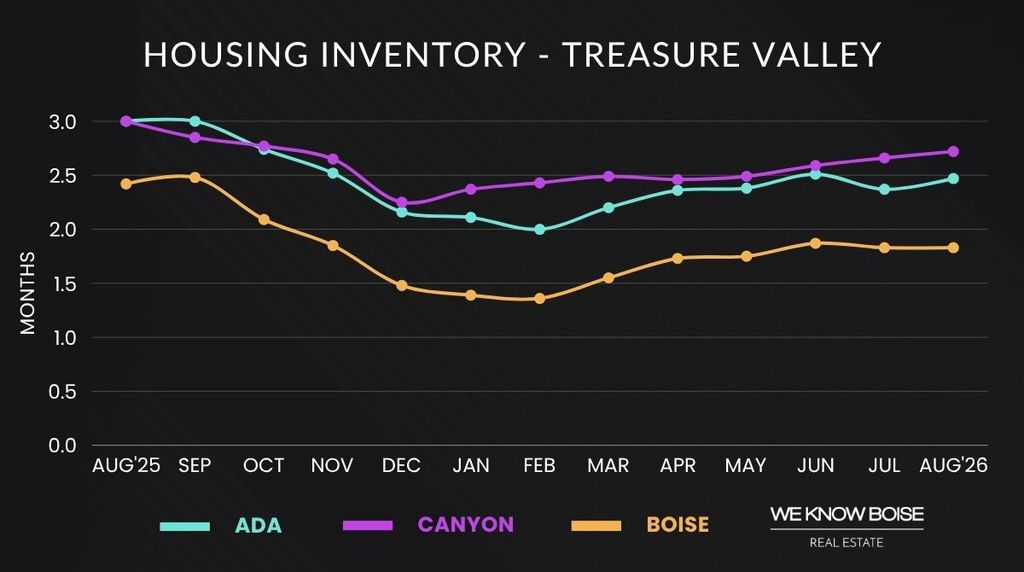
Supply also remained below last year’s level. Ada County ended August with 2.47 months of supply, compared with 2.96 months a year ago. Canyon County had 2.72 months of supply, also below last August.
Months of supply measures how long it would take to sell the current inventory at the current sales pace if no new listings came on the market. Economists generally consider four to six months a balanced market. Both counties remain below that range.
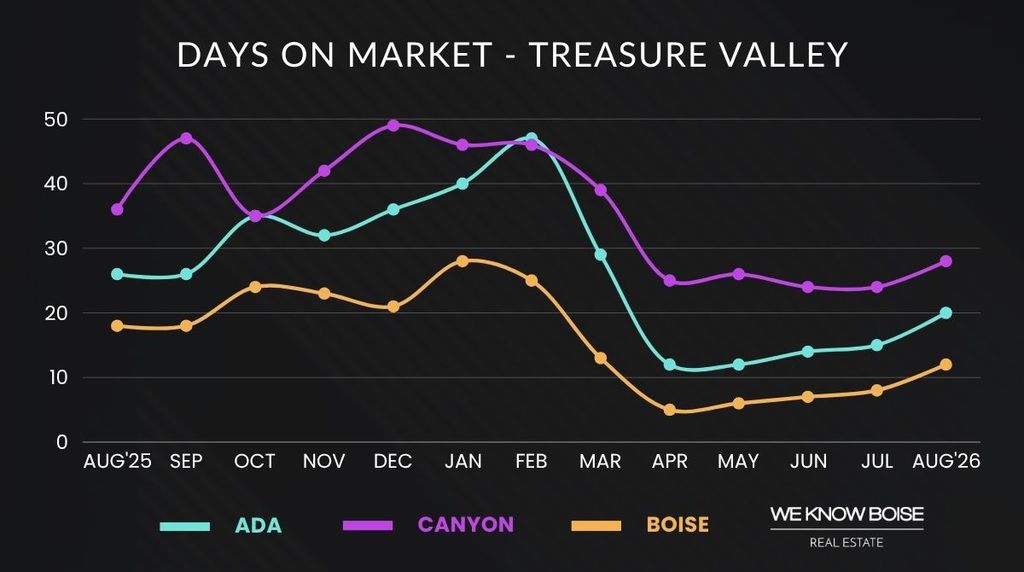
Homes also sold faster than they did last year. The median days on market was 20 days in Ada County, compared with 26 days last August. In Canyon County, the median fell from 36 days to 28.
Lower supply and shorter market times also help explain why prices have remained above last year’s levels. Buyers have more choices than they did during the tightest years of the market, but inventory is still being absorbed quickly enough to keep broad downward pressure on prices in check.
Homes that are priced appropriately and in good condition are still moving. Listings that need updates or are priced ahead of competing homes are taking longer to find a buyer.
As the Treasure Valley moves into fall, inventory typically reaches its seasonal high while sales activity begins to slow. Mortgage rates will remain one of the biggest factors shaping demand. With rates higher than they were last year and supply still relatively limited, affordability will remain a constraint heading into the final months of the year.
By the Numbers: 2026 Real Estate Market Overview
Median Price: What You Should Know
The median sale price provides a snapshot of home affordability in the market. It represents the midpoint of all home sales, giving buyers an idea of what they might expect to pay. A higher median price typically reflects a more expensive housing market.
Inventory Trends and What They Mean
The number of homes available for sale shows how much choice buyers have in the market. Changes in this number indicate whether inventory is growing or shrinking, which can affect competition and pricing for buyers.
What Days on Market Tell Us About Demand
Median days on market measures how long it takes for homes to go under contract. A lower number suggests stronger buyer demand and a faster-moving market, while a higher number indicates homes are taking longer to sell.
Boise Market Trends
- Median list price: $565,000 (up 0.4%)
- Median sold price: $560,000 (up 0.4%)
- Average price per square foot: $329 (up 2.8%)
- Total home sales: 321 (up 21)
- Median days on market: 12 (down 6)
- Available homes for sale: 1.83 months of supply (down 0.59)
- 30-year mortgage rate: 6.76% (up 0.41)
Treasure Valley Market Trends
- Ada County: $595,000 (up 6.5%)
- Eagle: $936,888 (up 17.1%)
- Garden City: $579,900 (fewer than 10 homes sold)
- Kuna: $474,990 (up 9.1%)
- Meridian: $579,990 (up 6%)
- Star: $559,900 (down 5.6%)
- Canyon County: $443,100 (up 3.1%)
- Caldwell: $420,450 (up 2.8%)
- Middleton: $499,945 (down 6%)
- Nampa: $431,990 (up 2.9%)

More From Our Blog


Select information in this We Know Boise market report was obtained from the Intermountain MLS (IMLS) on September 4th, 2026. While the data is deemed reliable, it is not guaranteed. City-specific data refers to single-family homes on less than one acre, whereas county-level data includes homesites of all sizes. The "months of supply" metric is based on a 12-month rolling average. Home prices mentioned combine both existing and new construction properties. Comparisons are based on year-over-year changes unless otherwise specified.
Posted by Lisa Kohl onEnjoy this blog post? Click here to subscribe for updates
Leave A Comment