Last month brought a rare mix of easing rates, expanding inventory, and rising home prices across Ada County. Hallmarks of the kind of measured appreciation typical of a balanced market: not a boom, but far from a standstill.
In Ada County, the median home price in September was $555,000, up 3.8% from last year. The median home price in Canyon County was $422,165, essentially flat year over year, but nearly 2% higher than six months ago. While appreciation in Canyon County has historically been more modest, prices remain stable.
Inventory levels across the Treasure Valley remain elevated compared to earlier this year. Ada County has slightly over 3 months of supply. (Months of supply reflects how long it would take to sell all active listings at the current pace of sales, assuming no new inventory enters the market.) In Canyon County there is currently 2.85 months of supply.
Home prices in Eagle reached $957,675 in September, a 30% increase from a year ago. While that figure is headline-worthy, it comes alongside 4.75 months of inventory, signaling a luxury market that’s active but more deliberate.
The increase in available homes hasn’t translated into longer selling times, at least not broadly. Days on market, or the typical time it takes a property to go under contract, remained unchanged at 26 days in Ada County and rose to 47 in Canyon. Even so, homes in Ada County are still selling for 100% of asking price on average, reinforcing that buyers are still active and willing when a home is well-presented and appropriately priced.
Interest rates have quietly opened a small window, how long it stays open is another question. The average 30-year fixed mortgage rate dipped to 6.27% last week, down from summer highs.
While the shift has been subtle, it’s already prompted a small uptick in refinance activity. With home prices increasing gradually rather than surging and inventory at its highest point in over two years, buyers today have more options and more time to make informed decisions when buying a home than at any point since early 2022.
If rates continue to ease, even modestly, it could continue this measured pace of activity, stable prices, moderate competition and steady movement. But if rates were to fall more aggressively, history suggests we could see conditions change quickly. A sharper drop often draws sidelined buyers back into the market, compressing inventory and fueling competition. That’s not a guarantee, especially if falling rates result from broader economic conditions.
For sellers, the takeaway is similar. The holidays often thin out the competition both among listings and showings. But for well-presented homes priced in line with market expectations, demand hasn’t disappeared. Many are still selling at or near asking prices, often within a few weeks.
By the Numbers: September 2025 Real Estate Market Overview
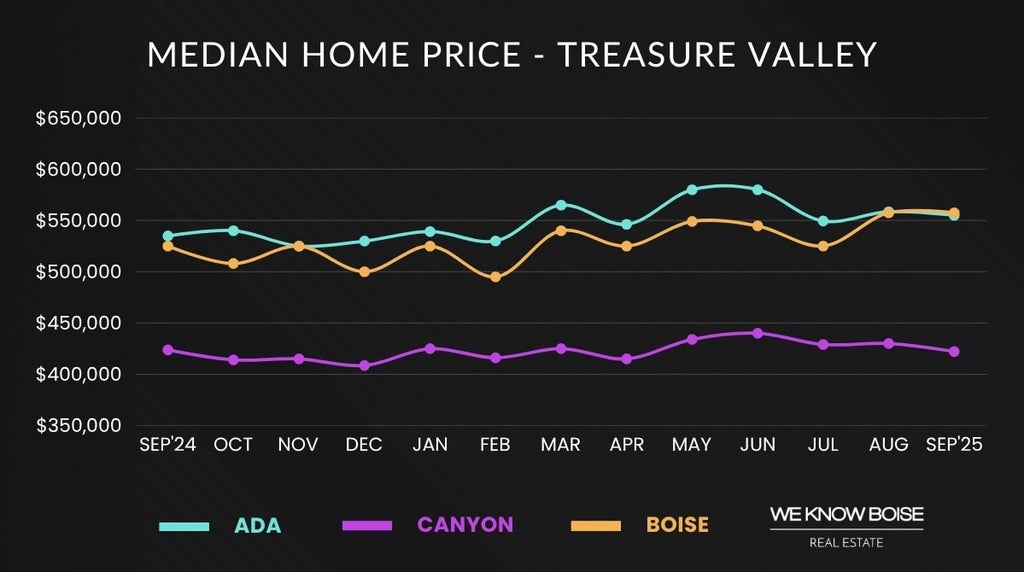
Median Price: What You Should Know
The median sale price provides a snapshot of home affordability in the market. It represents the midpoint of all home sales, giving buyers an idea of what they might expect to pay. A higher median price typically reflects a more expensive housing market.
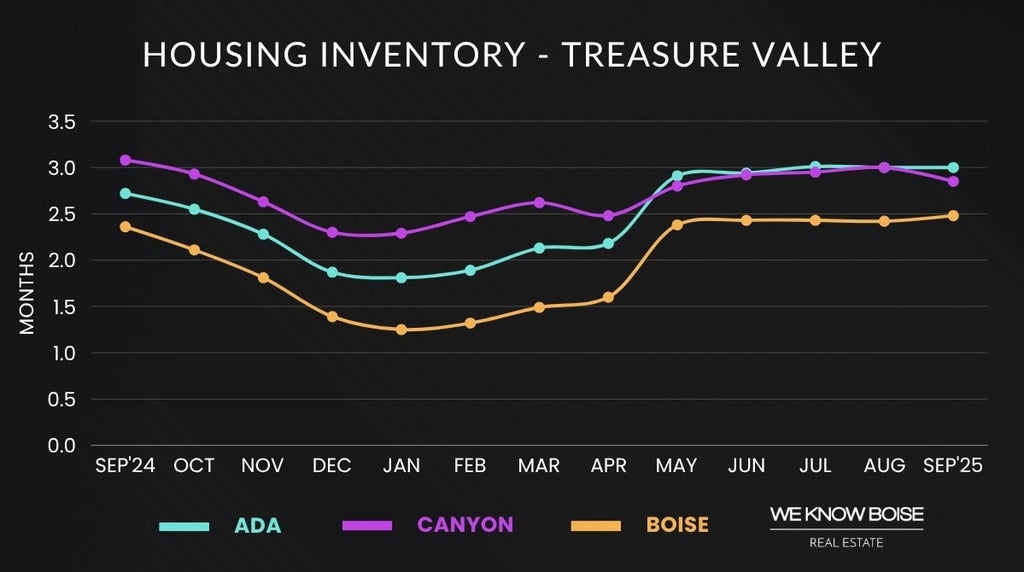
Inventory Trends and What They Mean
The number of homes available for sale shows how much choice buyers have in the market. Changes in this number indicate whether inventory is growing or shrinking, which can affect competition and pricing for buyers.
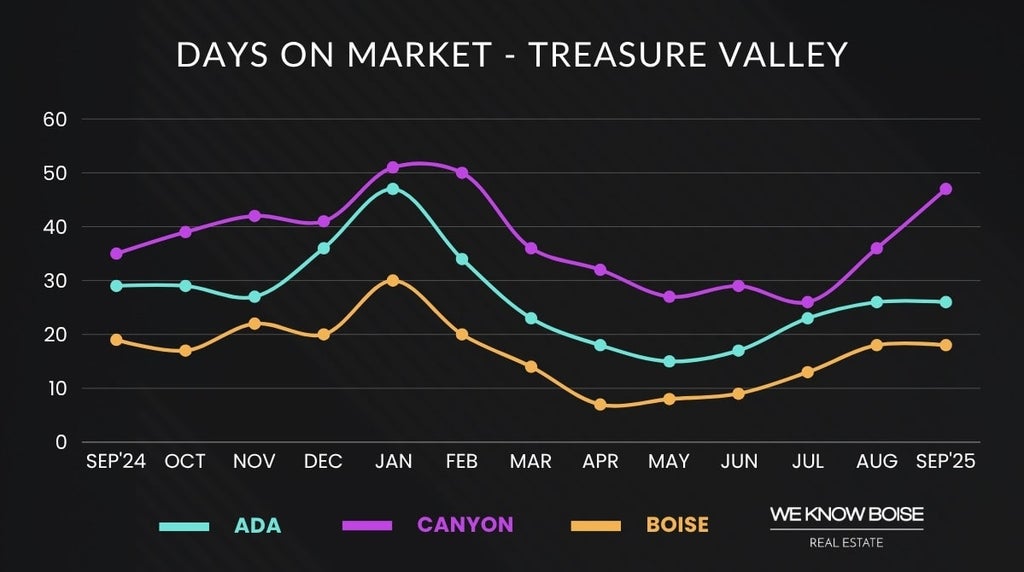
What Days on Market Tell Us About Demand
The average number of days on market measures how long it takes for homes to sell. A lower number suggests a fast-moving market with high demand, while a higher number indicates homes are taking longer to sell, often reflecting lower buyer activity.
Boise Market Trends
- Median list price: $552,500 (up 4.3%)
- Median sold price: $557,500 (up 6.2%)
- Average price per square foot: $315 (up 2.3%)
- Total home sales: 290 (up 21)
- Median days on market: 18 (down 1)
- Available homes for sale: 2.48 month supply (up 0.12)
- 30-year mortgage rate: 6.35% (up 0.17)
Treasure Valley Market Trends
- Ada County: $555,000 (up 3.8%)
- Eagle: $957,675 (up 30.3%)
- Garden City: $424,250 (*fewer than ten sales)
- Kuna: $448,990 (down 2.3%)
- Meridian: $515,000 (down 1%)
- Star: $572,000 (up 11.1%)
- Canyon County: $422,165 (down 0.4%)
- Caldwell: $399,753 (up 5.5%)
- Middleton: $459,950 (down 13.2%)
- Nampa: $415,000 (down 2.1%)
More From Our Blog
Select information in this We Know Boise market report was obtained from the Intermountain MLS (IMLS) on October 10, 2025. While the data is deemed reliable, it is not guaranteed. City-specific data refers to single-family homes on less than one acre, whereas county-level data includes homesites of all sizes. The "months of supply" metric is based on a 12-month rolling average. Home prices mentioned combine both existing and new construction properties. Comparisons are based on year-over-year changes unless otherwise specified.
Posted by Lisa Kohl on




Leave A Comment